Data Analysis in Excel: The Best Guide

Microsoft Excel is one of the most popular applications for data analysis. Equipped with built-in pivot tables, they are without a doubt the most sought-after analytic tool available. It is an all-in-one data management software that allows you to easily import, explore, clean, analyze, and visualize your data. In this article, we will discuss the various methods of data analysis in Excel.
Sorting
Sorting data is a very critical and vital part of Data Analysis. You can sort your Excel data by multiple columns or even a single column. The sorting is done in ascending or descending order as well.
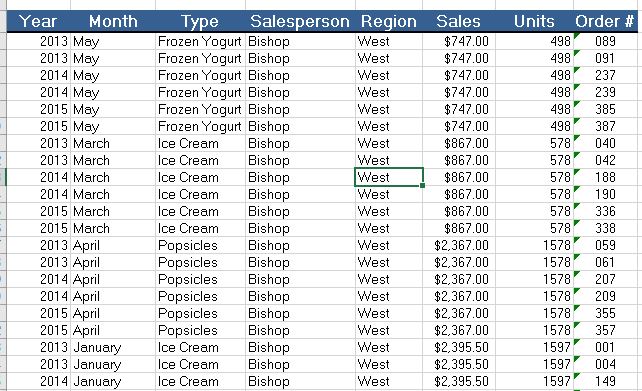
Single Column
Consider the following data:
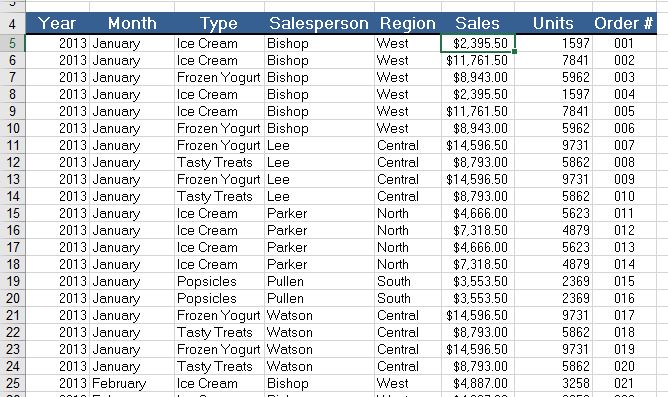
Let’s sort the data on the basis of Units. To do that, follow these steps:
- The first step is to click on any cell in the column which you want to sort.
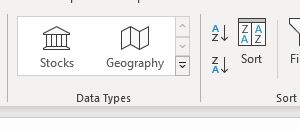
- Next, to sort in ascending order, click on AZ which is found on the Data tab, in the Sort & Filter group.
Result:
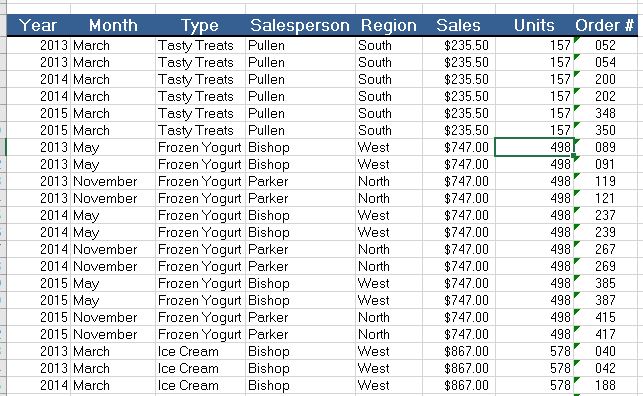
Note: To sort in descending order, click ZA.
Multiple Columns
You can also sort on multiple columns in your worksheet. Execute the following steps.
- Click on Sort which can be found on the Sort & Filter group, on the Data tab.
The sort dialog box will appear.
- Add the levels by which you want to sort.
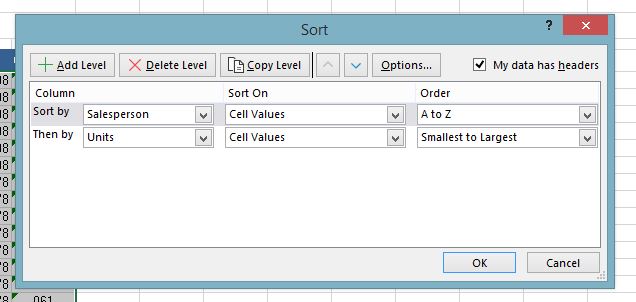
- Click OK.
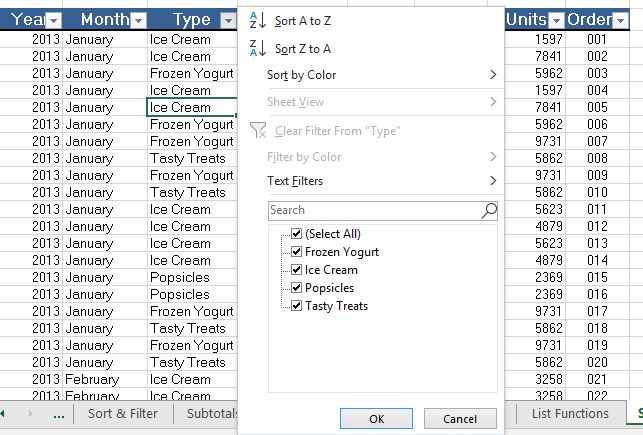
Filtering
We use filtering when we want to get the data that will match the specific conditions.
- Click on any single-cell inside your data.
- Go to Data Tab > Sort and Filter > Filter
- You will notice the arrowheads have appeared in the columns.
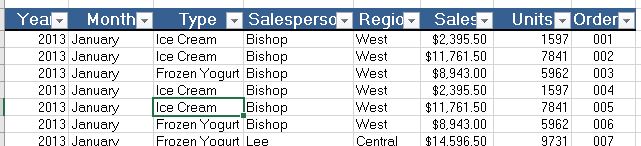
You can now filter according to your needs.
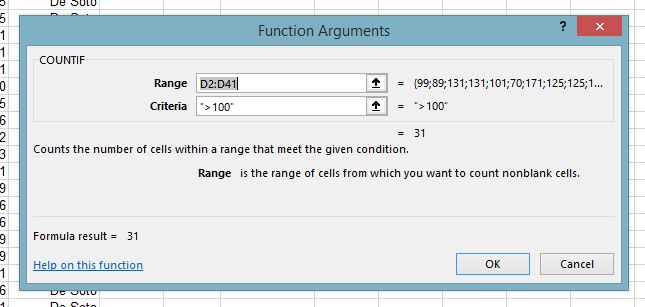
COUNTIF
COUNTIF is a very commonly used Excel function used for counting cells in a range that satisfy a single condition.
Syntax:
=COUNTIF (range, criteria)
Example:
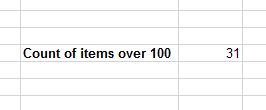
Let’s get the count of items that are over 100.
FREE Course: Introduction to Data Analytics
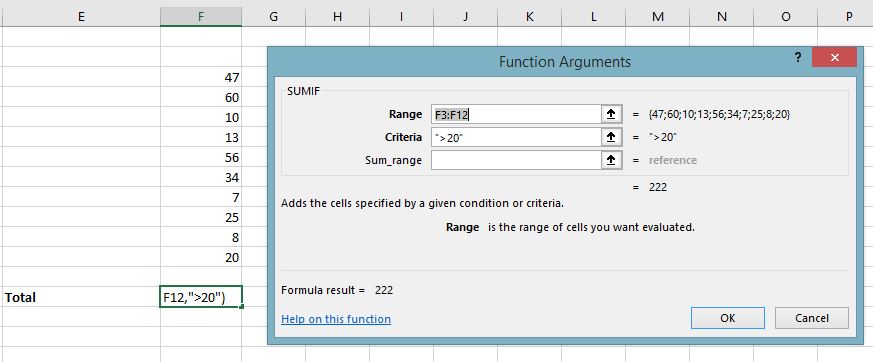
Mastery to Data Analytics Basics is a Click Away!START LEARNINGSUMIF
The Excel SUMIF function returns the sum of cells that meet a single condition.
Syntax:
=SUMIF (range, criteria, [sum_range])
Example:
Let’s use the SUMIF function to calculate the cells based on numbers that meet the criteria.
Pivot Tables
Pivot tables are known for being the most purposeful and powerful feature in Excel. We use them in summarizing the data stored in a table. They organize and rearrange statistics (or "pivot") to bring crucial and valuable facts to attention. It helps take an extremely large data set and see the relevant data you need in a crisp, easy, and manageable way.
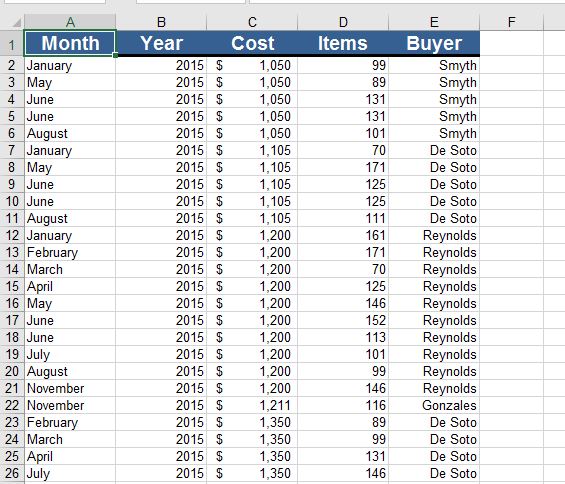
Sample Data
The sample data that we are going to use contains 41 records with 5 fields of information on the buyer information. This data is perfect to understand the pivot table.
Insert Pivot Tables
To insert a pivot table in your sheet, follow the steps mentioned below:
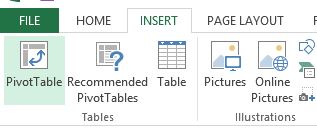
- Click on any cell in a data set.
- On the Insert tab, in the Tables group, click PivotTable.
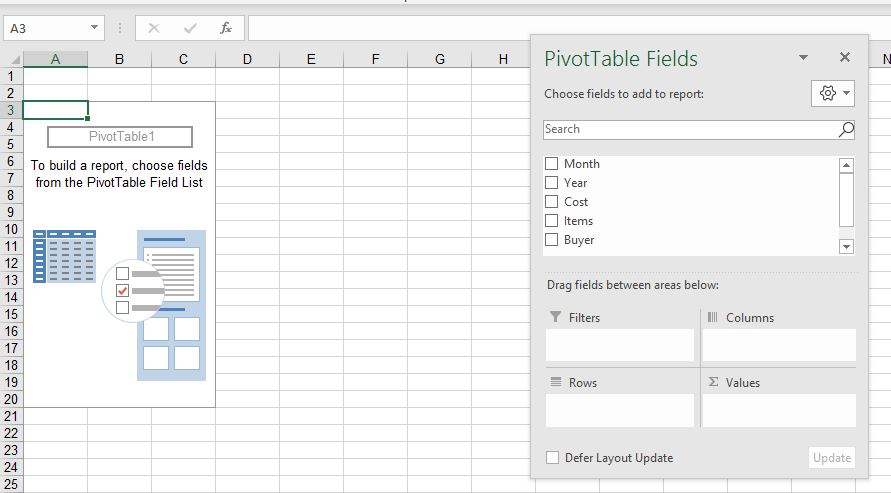
A dialog box will appear. Excel will auto-select your dataset. It will also create a new worksheet for your pivot table.

- Click Ok. Then, it will create a pivot table worksheet.
Drag Fields
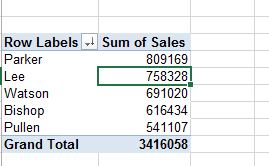
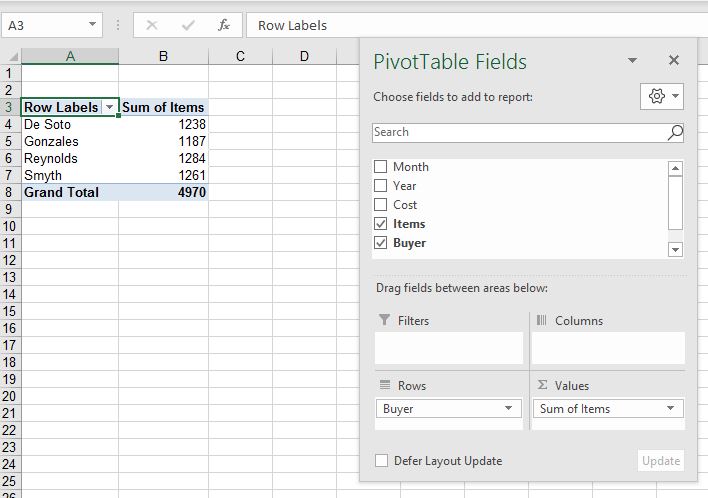
To get the total items bought by each buyer, drag the following fields to the following areas.
- Buyer field to Rows area.
- Items field to Values area.
What-If Analysis with Solver
What-If Analysis is the process of changing the values to try out different values (scenarios) for formulas. You can use several different sets of values in one or multiple formulas to explore all the different results.
Perfect for what-if analysis, a solver is a Microsoft Excel add-in program that is helpful on many levels. You can use this feature to find an optimal (maximum or minimum) value for a formula in one cell, which is known as the objective cell. This is subject to some constraints, or limits, on the values of other formula cells on a worksheet.
Solver works with a group of cells, called decision variables or simply variable cells, used in computing the formulas in the objective and constraint cells. Solver also adjusts the decision variable cells' values to work on the limits on constraint cells. This thereby helps in producing the desired result for the objective cell.
Activating Solver Add-in
- On the File tab, click Options.
- Go to Add-ins, select Solver Add-in, and click on the Go button.
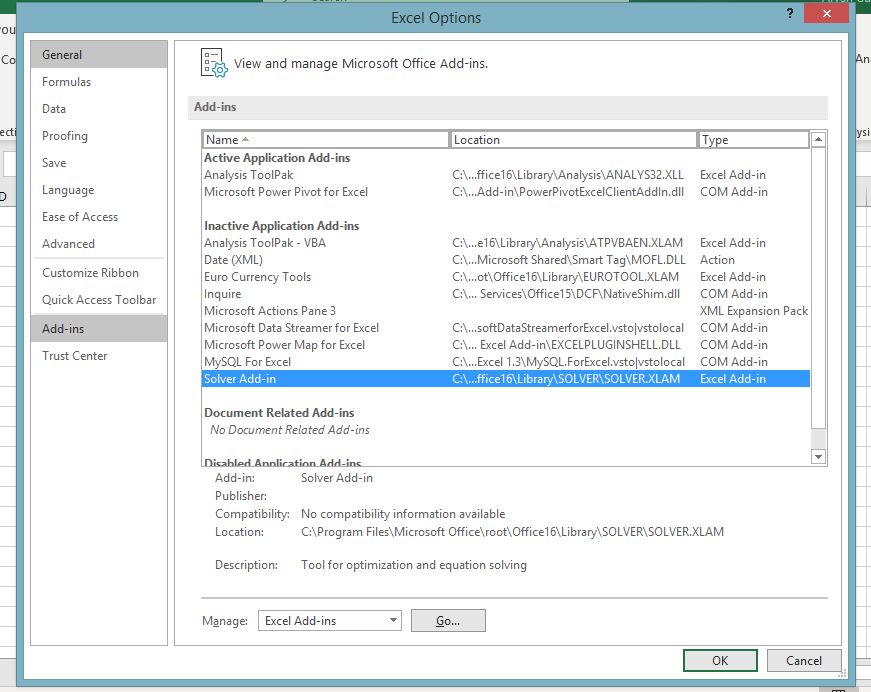
- Check Solver Add-in and click OK.
FREE Business Analytics With Excel Course
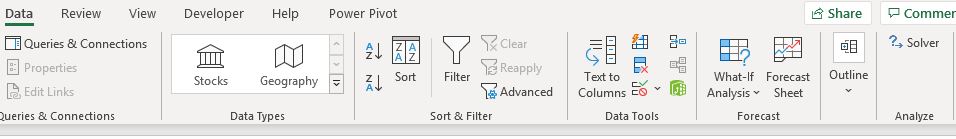
Start your Business Analytics Learning for FREESTART LEARNING- In the Data tab, in the Analyze group, you can see the Solver option is added.
How to Use Solver in Excel
In this example, we will try to find the solution for a simple optimization problem.
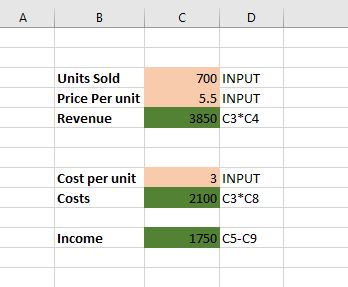
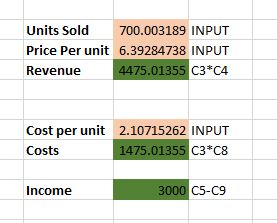
Problem: Suppose you are the owner of a business and you want your income to be $3000.
Goal: Calculate the units to be sold and price per unit to achieve the target.
For example, we have created the following model:
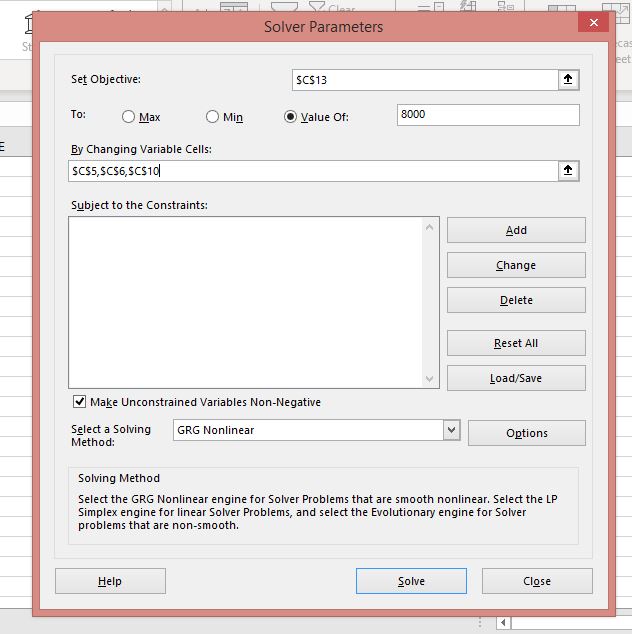
- On the Data tab, in the Analysis group, click the Solver button.
- In the set objective, select the income cell and set it’s value to $3000.
- To Change the variable cell, select the C3, C4, and C8 cells.
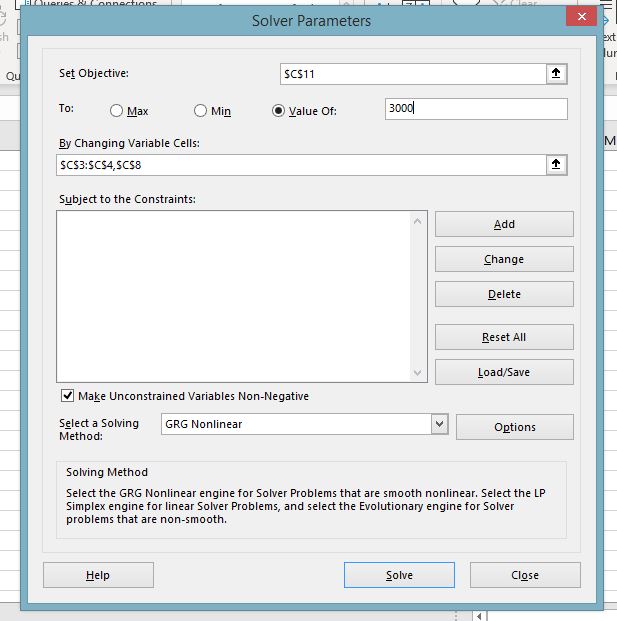
- Click Solve.
Your data model will change according to the conditions.
Data Analysis Toolpak
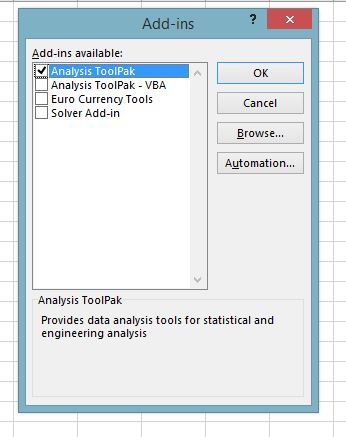
- Click the File tab, click Options, and then click the Add-Ins category.
- Select Analysis ToolPak and click on the Go button.
- Check Analysis ToolPak and click on OK.
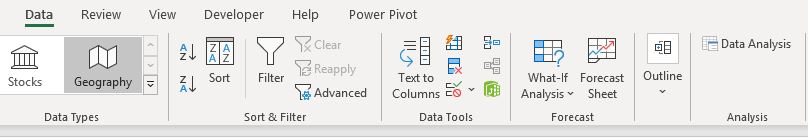
- On the Data tab, in the Analysis group, you can now click on Data Analysis.
Descriptive Statistics
Descriptive statistics are one of the fundamental ‘must know’ information of any data set. It gives you an idea on:
- The mean, median, mode, and range.
- Variance and standard deviation.
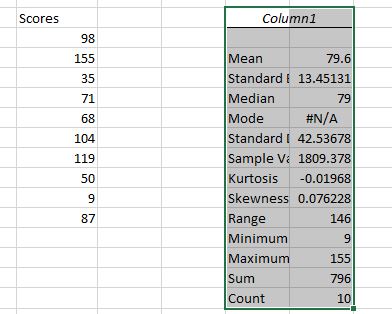
Suppose we have a score of a batsman of his last 10 matches. To generate the descriptive analysis, follow the steps mentioned below.
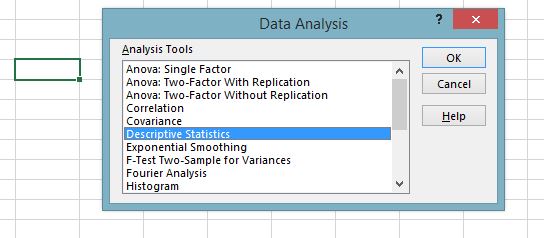
- Go to the Data tab > Analysis group > Data analysis.
- Select Descriptive Statistics and click OK.
- Select the range of your input.
- Select the range from where you want to display the output.
- Check the summary statistics.
Your descriptive statistics is ready.
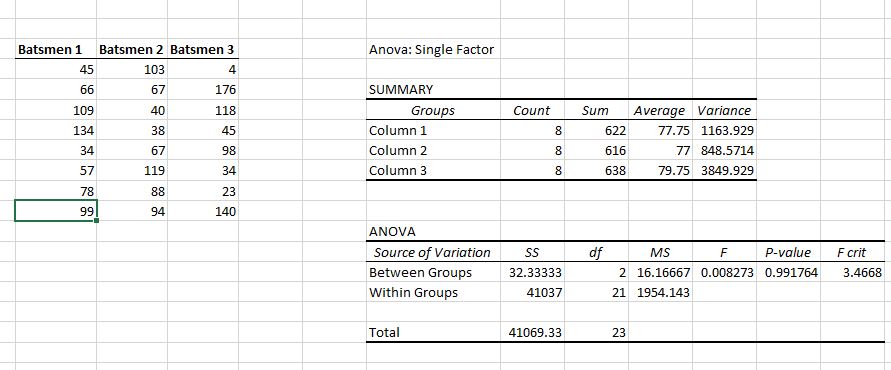
ANOVA
ANOVA ( Analysis of variance ) in Excel is a statistical method that is used to test the difference between two or more means.
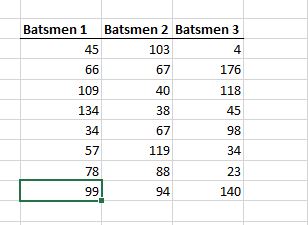
Below you can find the scores of three batsmen for their last 8 matches.
To implement the single factor ANOVA, follow the steps.
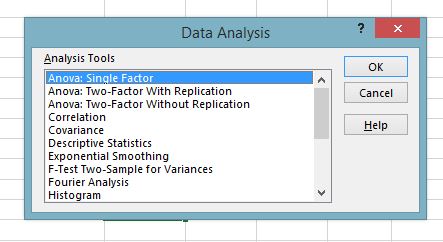
- Go to the Data tab > Analysis group > Data analysis.
- Select Anova: Single Factor and click OK.
- Select the input and output range and click OK.
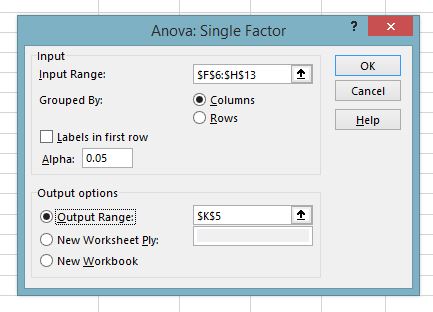
Your single factor ANOVA is ready.
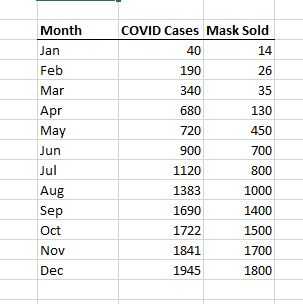
Regression
In Excel, we use regression analysis to estimate the relationships between two or more variables.
Consider the following data where we have several COVID cases and masks sold in a particular month.
- Go to the Data tab > Analysis group > Data analysis.
- Select Regression and click OK.
The following argument window will open.
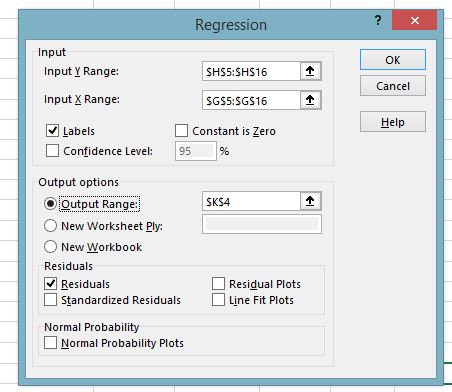
Select the Input Y Range as the number of masks sold and Input X Range as COVID cases. Check the residuals and click OK.
You will get the Summary Output.
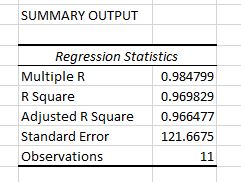
The Multiple R is the Correlation Coefficient that measures the strength of a linear relationship between two variables.
R Square signifies the Coefficient of Determination, which is used as an indicator of the goodness of fit. With the help of R Square, you can track how many points fall on the regression line.
Standard Error is another goodness-of-fit measure that shows the precision of your regression analysis.
Are you looking for career growth in Business Analysis? Then sign-up for our exclusive PGP In Business Analytics course and solve complex business problems quickly!
Conclusion
With this, we come to the end of this article on data analysis in Excel. We have seen and worked out some examples of some of the powerful methods and features of Excel data analysis.
Boost your analytics career with powerful new Microsoft Excel skills by taking the Business Analytics with Excel course, which includes Power BI training
This Business Analytics course course teaches you the basic concepts of data analysis and statistics to help data-driven decision making. This training introduces you to Power BI and delves into the statistical concepts that will help you devise insights from available data to present your findings using executive-level dashboards


Comments
Post a Comment